
Opening Statement
The United States is entering a period in which multiple critical infrastructure systems are simultaneously approaching conditions where recovery becomes progressively slower, more expensive, and, in some cases, operationally infeasible. Individually, these pressures remain manageable. Collectively, they increase the probability that recovery becomes progressively slower, more expensive, or operationally infeasible.
The data is not speculative. Interconnection queues are documented, lead service lines are counted, mineral dependencies are mapped, insurance losses and uninsured rates are tracked, data-center power constraints are forecast, submarine-cable disruptions are recorded, port congestion is measured, and supply-chain concentration has been demonstrated. The question is not whether these conditions exist. It is whether the conditions required for reversibility remain observable today.
This memorandum asks not whether governance mechanisms support reversibility (causal claim), but which conditions of reversibility are currently observable within existing frameworks (empirical claim). This shift eliminates causal fragility. An auditor cannot dispute observability; they can only recommend additional measurement. A condition is classified as Not Observable when no measurement framework exists to detect it, no data source is identified, and no agency claims jurisdiction over its tracking.
The aggregate infrastructure gap is $3.7 trillion over the next decade (ASCE, 2025 Report Card for America's Infrastructure) [0]. The cost of continued systemic deterioration is estimated at $5 trillion in lost gross economic output over two decades, 2024–2043 (ASCE, 2025) [0].
The full taxonomy of seven Reversibility Conditions (RC-1 through RC-7) is defined in §ES.2 and applied across all eight sectors in §10.3.
ES.1 — The Recognition–Action Gap
The pattern that unites the eight sectors assessed in this memorandum is the separation between the moment a risk is recognized and the moment corrective action can be implemented. Governments know, but do not act — not through negligence, but because governance cycles operate on timelines incompatible with the velocity of deterioration.
The gap varies dramatically by sector. Four sectors carry quantified lock-in durations:
- Grid interconnection: ~4.5 years (55 months) for the typical project reaching commercial operation in 2024 — double the figure a decade ago (projects built 2000–2007 took under 2 years). At end-2024 the active queue stood at ~2.3 TW, roughly twice the 1.28 TW installed U.S. fleet. Only 13% of capacity that requested interconnection 2000–2019 had reached commercial operation by end-2024; 77% was withdrawn. [1]
- Water lead-pipe replacement: 10 years under the 2024 Lead and Copper Rule Improvements (LCRI), compliance deadline November 1, 2037 — subject to pending industry/utility litigation. The EPA revised its national lead service line estimate from ~9.2 million (7th DWINSA, 2023) to ~4 million (Nov 2025), based on mandatory state inventories under the LCRR. The reduction is driven by improved data but is contested: non-reporting systems were assumed to have zero lead lines, and some utilities redesignated lines from "lead" to "unknown." Independent analysts suggest the true figure may be closer to 5 million. [2]
- Critical-mineral federal permitting: 7–10 years for a single mine, among the longest worldwide. Discovery-to-production spans ~29 years (second longest after Zambia). [3]
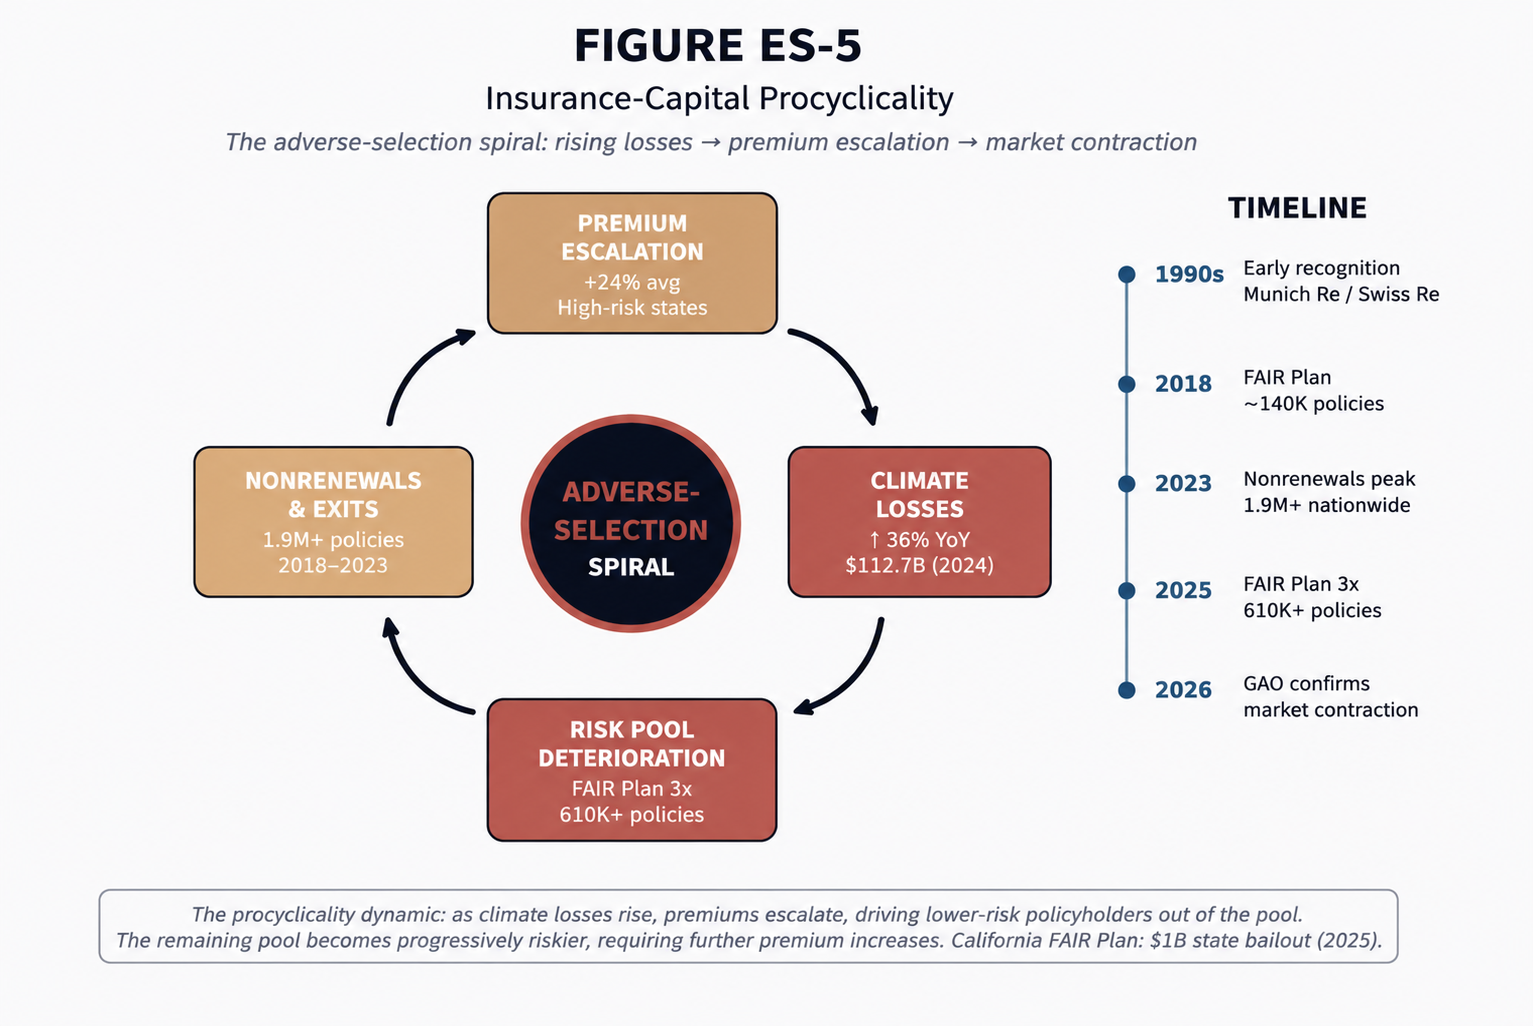
- Insurance climate-risk adaptation: ~30 years from the insurance industry's early-1990s recognition of anthropogenic climate risk to present-day market repricing. Munich Re and Swiss Re began publicly warning markets in the early 1990s; ~80 insurers formed the UNEP Insurance Industry Initiative by the mid-1990s. The present-day arc is strongly documented: California FAIR Plan tripled from ~140,000 policies in 2018 to 610,000+ by June 2025; 1.9 million+ nonrenewals nationwide 2018–2023; a February 2026 GAO report provides the most authoritative federal confirmation of market contraction. [4]
The remaining four sectors (ports, telecommunications, AI infrastructure, supply chains) exhibit comparable lock-in dynamics through the Reversibility Conditions taxonomy (§10.3), though they lack single-duration headline figures. Their RC-2 (Response Velocity) and RC-4 (Institutional Flexibility) scores are uniformly Limited — the same systematic gap documented in the four quantified sectors.
All eight systems remain institutionally locked beyond the time horizon of elected and appointed decision-makers. The House operates on two-year cycles, the presidency on four-year cycles; senior appointee tenure often runs shorter than a full term. The Senate's six-year term offers partial insulation, but does not close the mismatch. Infrastructure assets operate on 20–50 year lifecycles. The interconnection queue (~4.5 years), mineral permitting (7–10 years), and lead-line replacement (10 years) all exceed or approach any single administration's effective tenure. Recognition of risk is not the constraint. Institutional response is.
Existing governance frameworks were not designed to observe reversibility. They monitor whether a system functions today, not whether it can still recover tomorrow. No single agency owns the full pattern. Each agency sees its own sector; no one sees the system. This is the gap the present memorandum addresses — and it is the argument for a new integrative layer: the National Resilience Dashboard.
The Dashboard does not merely diagnose; it measures whether reforms actually move the durations. Current federal posture (EO 14241, FAST-41 expansion, "energy dominance") is actively trying to compress several of these lock-in durations — mining permitting above all. The Dashboard observes whether those reforms produce measurable change, converting a political claim into an auditable metric. The governance challenge is therefore not a lack of information, but the absence of a cross-sector capability to determine whether intervention remains possible before reversibility is lost. The National Resilience Dashboard is proposed as the institutional mechanism to close that gap.
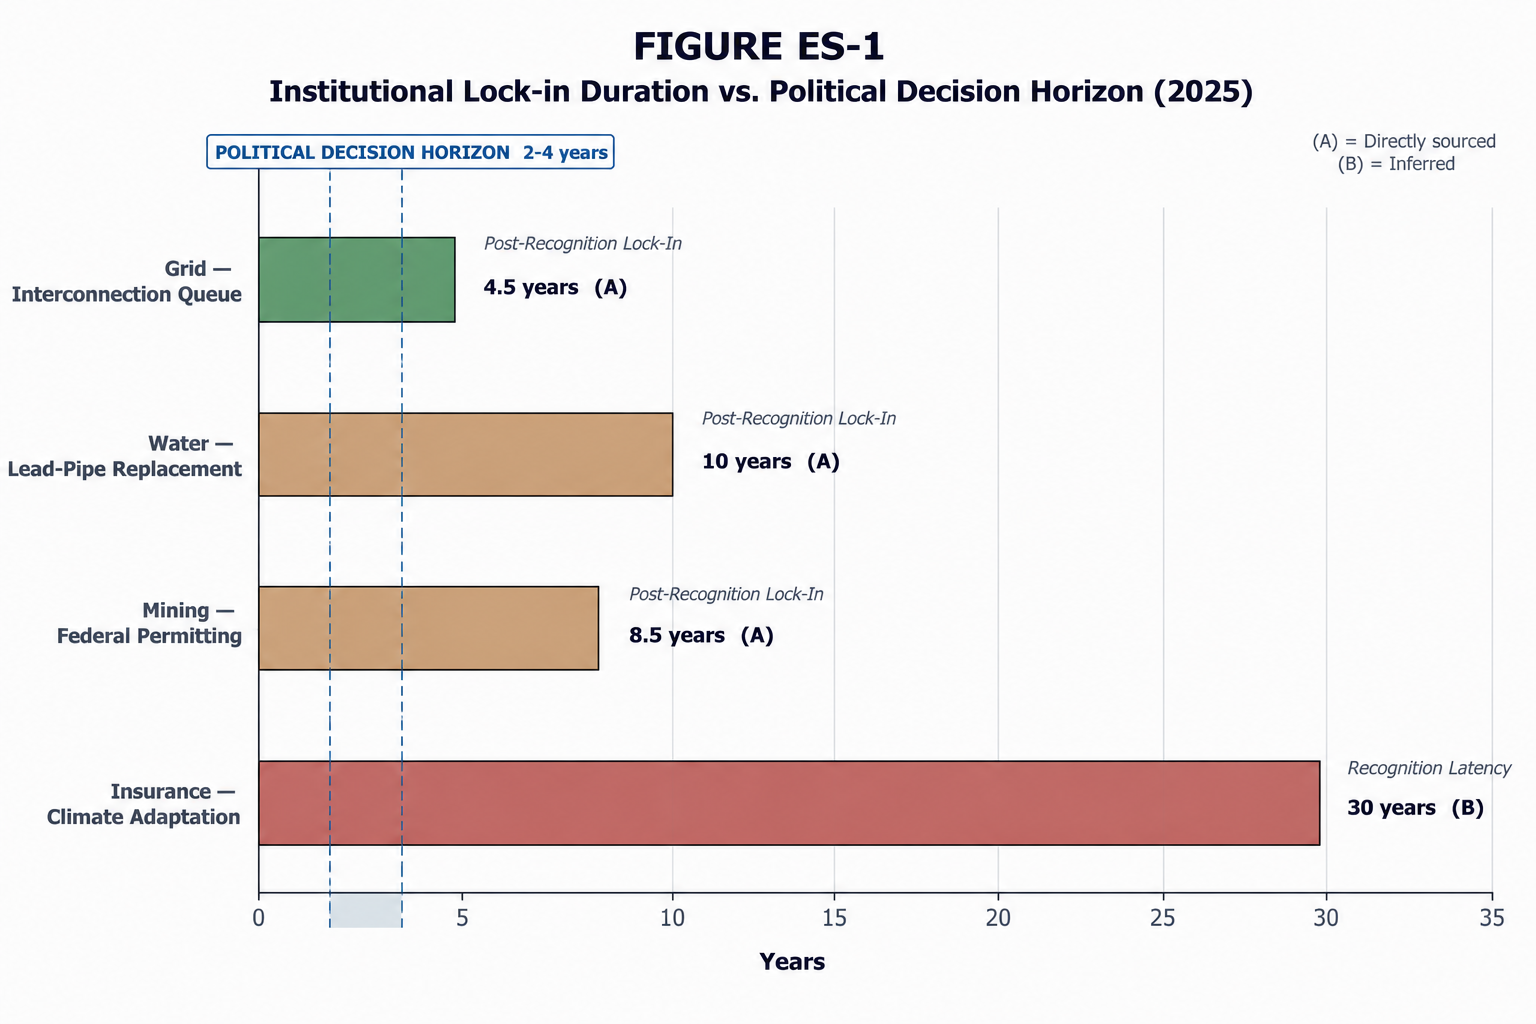
Click image to enlarge.
| Sector | Observable Lock-in | Duration (Years) | Evidence Class | Governance Consequence |
|---|---|---|---|---|
| Grid | Interconnection queue | ~4.5 | (A) | Investment and capacity deployment delayed; 77% attrition rate |
| Water | Lead-pipe replacement | 10 | (A) | Public-health risk persists; $50–80B need vs. $15B BIL funding |
| Mining | Federal permitting | 7–10 | (A) | Critical-minerals supply expansion delayed; 29-year discovery-to-production |
| Insurance | Climate market adaptation | ~30 | (B) | Long-term contraction of insurability; adverse-selection spiral in CA/FL/LA |
| Ports | Congestion + intermodal bottlenecks | — | (A) | ~$38B port needs through 2033; PIDP heavily oversubscribed |
| Telecom | Submarine cable vulnerability + rural broadband gap | — | (A) | 44 publicly reported global submarine-cable damages (2024–25); ACP ended June 2024 (~23M at peak enrollment); oligopoly concentration |
| AI/Data Centers | Power constraint + interconnection queue | — | (B) | 40% power-constrained by 2027 (Gartner); no federal siting authority |
| Supply Chains | Concentration + foreign dependency | — | (A) | China largest single supplier of critical pharma inputs (~40% by vol., 2024); ≥75% in 1 of 4 categories; no comprehensive reshoring strategy |
Notes: All rows measure institutional lock-in — the time during which the system remains institutionally unable to respond after risk recognition, or (for insurance) the latency from scientific recognition to market absorption. The four unquantified sectors carry Limited RC-2 and RC-4 scores, indicating comparable governance-cycle mismatch without a single headline number. For sectors without a single headline duration (—), the Evidence Class refers to the quality of evidence for the observable lock-in condition described, not to a specific duration figure. "Adverse-selection spiral" (the dynamic colloquially called a "death spiral" in the insurance literature) describes rising premiums driving lower-risk policyholders out of the pool, progressively worsening the risk composition and requiring further premium increases. See §9 and §10.4 for the quantitative evidence. (A) = directly sourced from primary data; (B) = inference based on cited evidence.
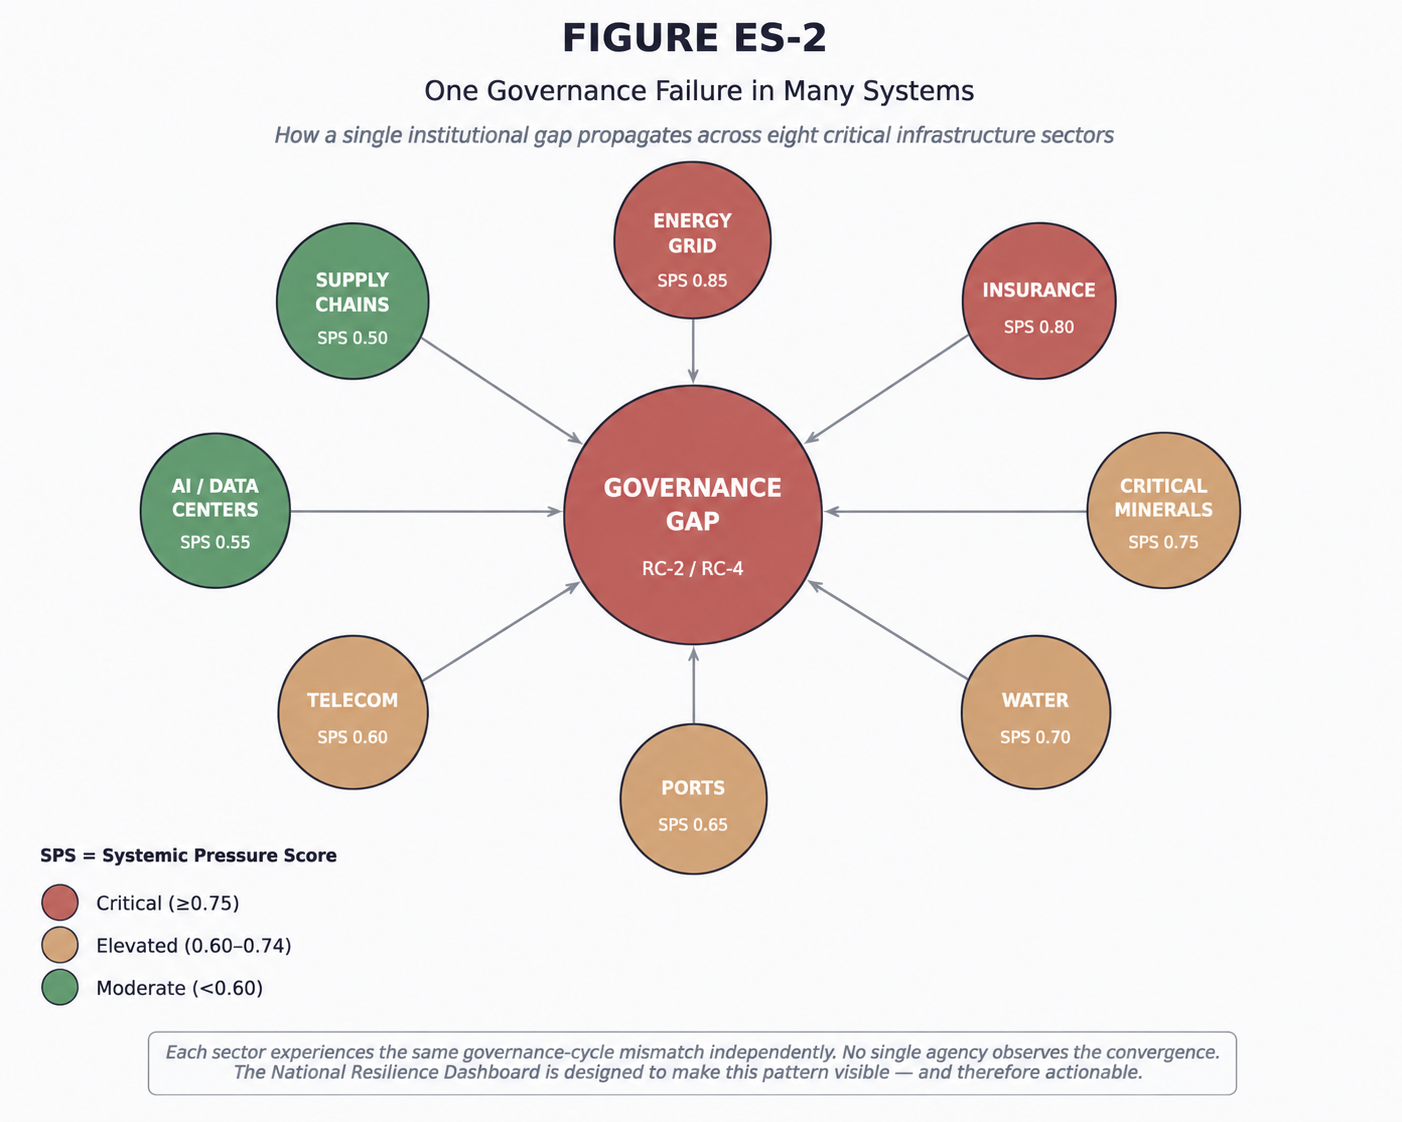
Click image to enlarge.
ES.2 — The Reversibility Framework
Rather than attempting to establish direct causal attribution, the framework evaluates whether the observable conditions necessary for reversibility are currently present. The assessment replaces fragile causal claims with an observable taxonomy: seven Reversibility Conditions (RC-1 → RC-7) classified for each sector as Strong, Partial, Limited, or Not Observable. An auditor cannot dispute whether a condition is observable; they can only recommend additional measurement.
Recovery Capacity
Capacity to restore critical functions after disruption
Observable proxy: Time to restoration; spare inventory; trained personnel
Response Velocity
Speed at which corrective actions activate
Observable proxy: Time alert-to-dispatch; exercise data; legislative response time
Resource Availability
Physical, financial, human resources available for response
Observable proxy: Lead times; pricing signals; stockpiles; funding streams
Institutional Flexibility
Capacity to adapt governance arrangements under stress
Observable proxy: Time to regulatory change; cross-jurisdictional authority scope
Diversity Of Options
Alternative pathways and redundancies in supply, routing, provision
Observable proxy: Herfindahl index of suppliers; route alternatives; geographic distribution
Financial Absorption
Absorb losses without systemic degradation or market collapse
Observable proxy: Solvency ratios; reserve funds; reinsurance capacity; federal backstops
Information Visibility
Ability to observe, measure, and communicate risk conditions before reversibility is lost
Observable proxy: Monitoring coverage; reporting frequency; data interoperability; public visibility
The RC Taxonomy does not replace the Systemic Intelligence Library (SIL) or the Threshold-Forecast Protocol (TFP); it functions as an explanatory bridge, organizing sectoral observations into reversibility-relevant conditions before interpreting them through P, ΔV, σ, and Lr.
The internal c-ECO architecture flows: SIL → TFP → Prudential → Governance. The operational Memorandum II version flows: Sectoral Indicators → RC → TFP → Prudential → Governance → Feedback. Both architectures are valid and used in this memorandum, with a clarifying sentence in each chapter indicating which pathway is operative.
Methodology and Source Hierarchy: Level I: Federal agencies and official bodies (DOE, DHS, EPA, USGS, NERC, FEMA, GAO, FCC, CISA, Federal Reserve, OECD, World Bank) Level II: Industry reports (ASCE Infrastructure Report Card, EPRI, reinsurance market reports, telecommunications analyses) Level III: Institute analysis, academic research, and c-ECO conceptual models
All evidence classified: (A) Directly supported by cited source; (B) Calculated or reasonable inference from multiple sources; (C) Research needed — indicator identified but data not yet available.
ES.3 — Sectors Exhibiting the Highest Systemic Pressure
Of the eight sectors assessed, four demonstrate the most advanced approach to irreversibility:
Energy/Grid — Critical (SPS 0.85)
- ASCE 2025 assigns Energy Infrastructure a grade of D+, down from C− in 2021 — one of only two categories to decline (ASCE, 2025)
- NERC projects approximately 224 GW of additional summer peak demand over the coming decade, with the 2025 forecast substantially higher than previous assessments, reflecting accelerating load growth driven primarily by electrification, industrial expansion, and AI-related demand (NERC 2025 LTRA)
- NERC identifies elevated long-term resource adequacy and transmission reliability risks across large portions of North America under current planning assumptions (NERC 2025 LTRA). Note: Grid Strategies has questioned NERC's demand-growth assumptions, suggesting the assessment may overstate near-term risk; this divergence is itself an observable uncertainty (σ) signal
- 70% of transformers at 25+ years; lead times expanded from 50 weeks (2021) to 120 weeks (2025) — a 140% increase that directly constrains RC-1 and RC-3
- Interconnection queue: ~55 months (4.5 years) for projects reaching commercial operation in 2024; active queue ~2.3 TW at end-2024; only 13% of capacity requesting interconnection 2000–2019 reached operation; 77% withdrawn (LBNL, 2025)
- 40% of existing AI data centers will be power-constrained by 2027 (Gartner, Nov 2024)
- July 2024: minor voltage fluctuation caused 60 data center disconnections and 1,500 MW load drop in the PJM region — grid-AI interdependency already operational, not hypothetical (Belfer Center / NERC incident report)
- Virginia: data centers consume approximately 24–26% of state power generation (Bean Kinney / Belfer Center)
- No federal authority exists to coordinate data center siting with grid capacity planning
- No strategic reserve of large power transformers exists in the United States; transformer cost increases: 60–80%
Source:
Primary Evidence Class: A
Insurance — Critical
- U.S. property insurance losses reached $112.7 billion in 2024, a 36% year-over-year increase and 52% above the 10-year average (Center for American Progress)
- Swiss Re Institute reports insured natural catastrophe losses exceeded $135 billion globally in 2024, continuing the long-term upward trend (Swiss Re Sigma 1/2025)
- Premium escalation has accelerated substantially in high-risk markets; reinsurance costs increased sharply in 2023 following years of compressed pricing
- The uninsured rate has risen sharply, with approximately 1 in 8 homeowners now lacking coverage in high-risk states; 1.9 million+ nonrenewals nationwide 2018–2023 (Senate Budget Committee)
- Multiple Florida insurers became insolvent between 2021 and 2023; California FAIR Plan: $1 billion state bailout (2025); FAIR Plan tripled from ~140,000 policies (2018) to 610,000+ (June 2025) (Yale Law Journal, Vol. 135)
- Evidence of adverse-selection dynamics has emerged in Florida, California, and Louisiana simultaneously — rising premiums driving lower-risk policyholders out, progressively worsening the risk pool. See §9 and §10.4 for quantitative evidence
- Swiss Re assesses at 1-in-10 the probability of $300 billion in global insured losses in a single year (Swiss Re Sigma 1/2025)
- State guaranty fund aggregate capacity: not publicly disclosed
- Federal reinsurance: proposed but not enacted
- Stafford Act: post-hoc, requires presidential declaration — not pre- positioned
- GAO Feb 2026: "most thorough federal analysis of homeowners insurance markets in years" — confirms market contraction (GAO-26-107867)
Source:
Primary Evidence Class: A
Critical Minerals — Critical
- USGS 2025 Final List: 60 critical minerals (up from 50 in 2022); 10 new additions: boron, copper, lead, metallurgical coal, phosphate, potash, rhenium, silicon, silver, uranium (USGS Federal Register, 7 Nov 2025)
- China: 98% of gallium; approximately 79% of natural graphite; approximately 78% of refined cobalt; approximately 69% of rare earths mine production and approximately 90% of rare earths processing (USGS Mineral Commodity Summaries 2025)
- United States: zero domestic production of numerous critical minerals; the United States remains highly import dependent across a large share of designated critical minerals, with complete import reliance for numerous commodities (USGS Mineral Commodity Summaries 2025)
- China's export controls on gallium and germanium (2023): demonstrated weaponization of supply concentration
- Permitting timelines: 7–10 years (U.S.) vs. 2–3 years (competitor jurisdictions); discovery-to-production ~29 years (second longest after Zambia) (S&P Global, 2024)
- No accelerated permitting pathway demonstrated; "friend-shoring" alternative (Australia, Canada) developing but not scaled
- USGS OFR 2025-1047 methodology assessed 1,200+ supply disruption scenarios the 60-mineral list; highest-risk minerals by probability-weighted GDP impact include samarium, rhodium, lutetium, terbium, dysprosium, gallium, germanium, gadolinium, tungsten, and niobium (USGS OFR 2025-1047)
Source:
Primary Evidence Class: A
Water — Critical
- ASCE 2025 assigns separate grades: Drinking Water (C−), Wastewater (D+), Stormwater (D), and Dams (D+), collectively indicating substantial long-term infrastructure deterioration (ASCE 2025)
- 9.2 million lead service lines remain in service (removal cost: $45 billion); EPA revised estimate to ~4 million (Nov 2025) — methodology contested (EPA 7th DWINSA; EPA News Release 25 Nov 2025; NRDC; Unleaded Kids)
- Wastewater capital needs: $181.2 billion (EPA Clean Watersheds Needs Survey)
- 2,522 high-hazard dams in poor or unsatisfactory condition (ASCE / ASDSO)
- Many water systems continue to lack baseline cybersecurity capabilities; Volt Typhoon intrusion: undetected for 5+ years (CISA / GAO 2024)
- GAO 2024: EPA lacks legal authority, strategy, and tools to address cyber risks comprehensively
- A single day of nationwide water-system disruption would generate severe economic losses across multiple sectors
- 153,000 individual systems, 50 state regulatory regimes, federal agency with limited enforcement authority
- Existing federal investments remain substantially below estimated long-term infrastructure needs
Source:
Primary Evidence Class: A
Additional Sectors (Summary)
Ports
ASCE 2025 assigns Ports a grade of C; approximately $38 billion in port needs through 2033 (ASCE 2025); PIDP heavily oversubscribed — only 123 of 300+ U.S. public ports had received awards through FY2025 (MARAD); vessel waiting times increased substantially during recent congestion events
Telecom
44 publicly reported global cable damages (2024–25) (Recorded Future / Insikt Group); ACP ended June 2024 (~23 million households at peak enrollment, estimated from FCC monthly data); carrier concentration (Comcast, Verizon, AT&T dominate); power dependency on commercial grid with limited backup
Ai/Data Centers
40% of existing AI data centers will be power-constrained by 2027 (Gartner, Nov 2024); July 2024: 60 facilities disconnected, 1,500 MW load drop; Virginia: ~24–26% of state power generation; large-load interconnection requests increasingly encounter multi-year connection delays, while generation interconnection queues average ~55 months for projects reaching commercial operation; no federal siting authority
Supply Chains
China is the largest single supplier of critical pharmaceutical inputs to the United States (~40% by volume, 2024; Atlantic Council); controls ≥75% of supply in 1 of 4 critical input categories; no comprehensive reshoring strategy for generic pharmaceuticals; JBS cyberattack (May 2021) disrupted 25% of U.S. beef processing for 3 days
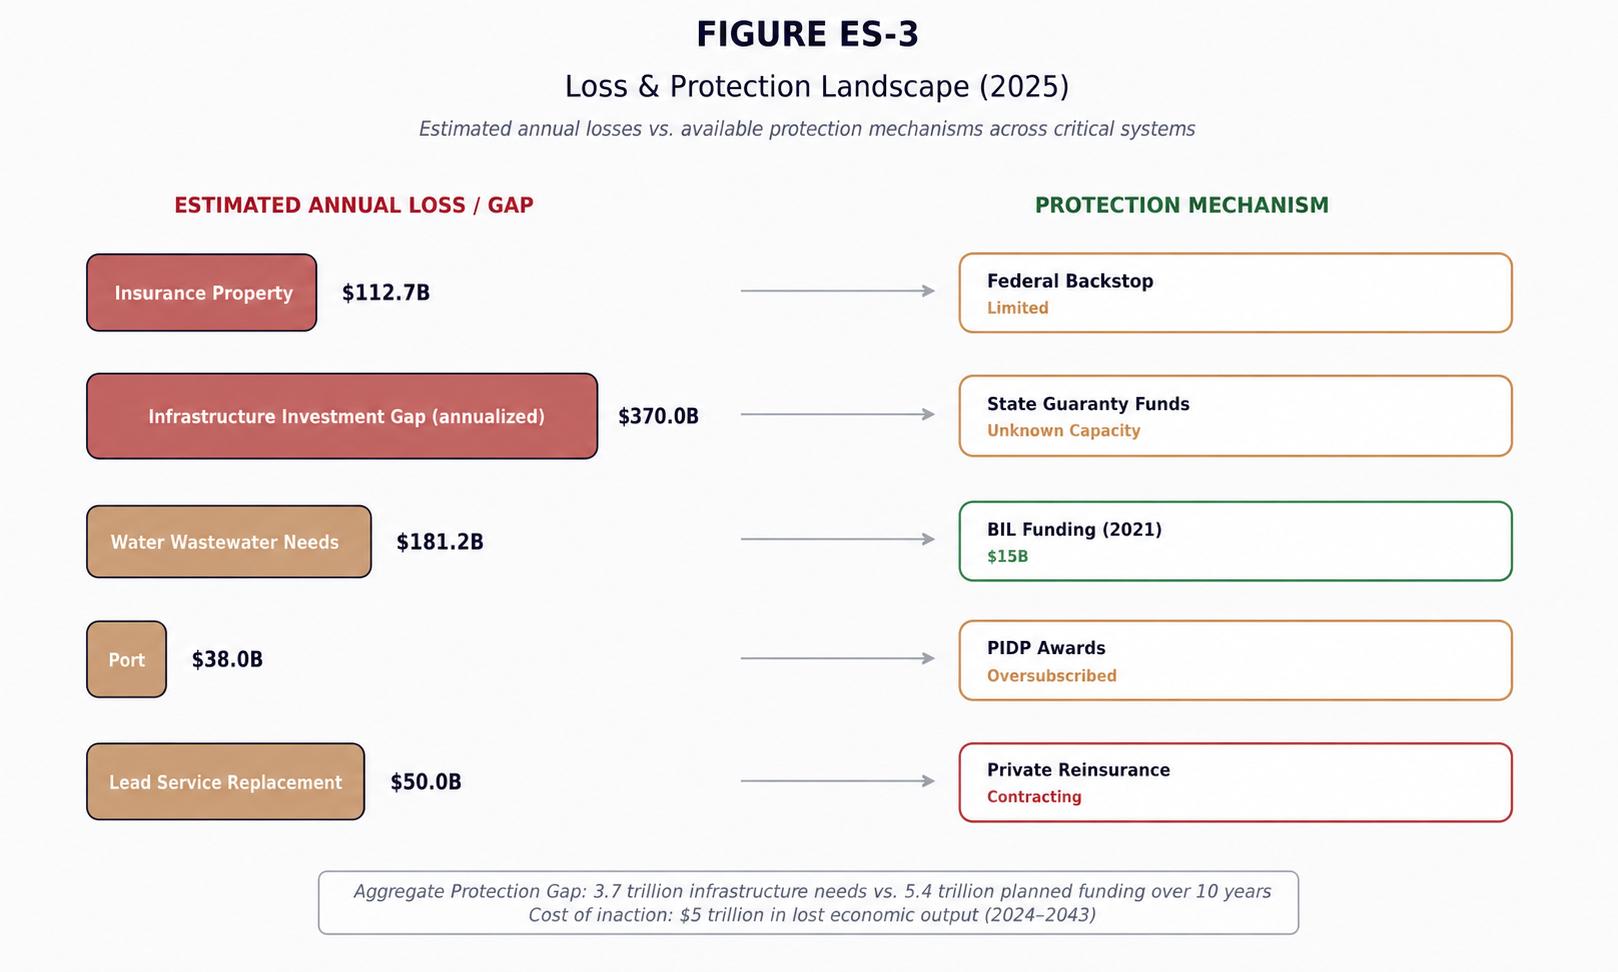
Click image to enlarge.
ES.4 — Reversibility Thresholds Converging (2027–2030)
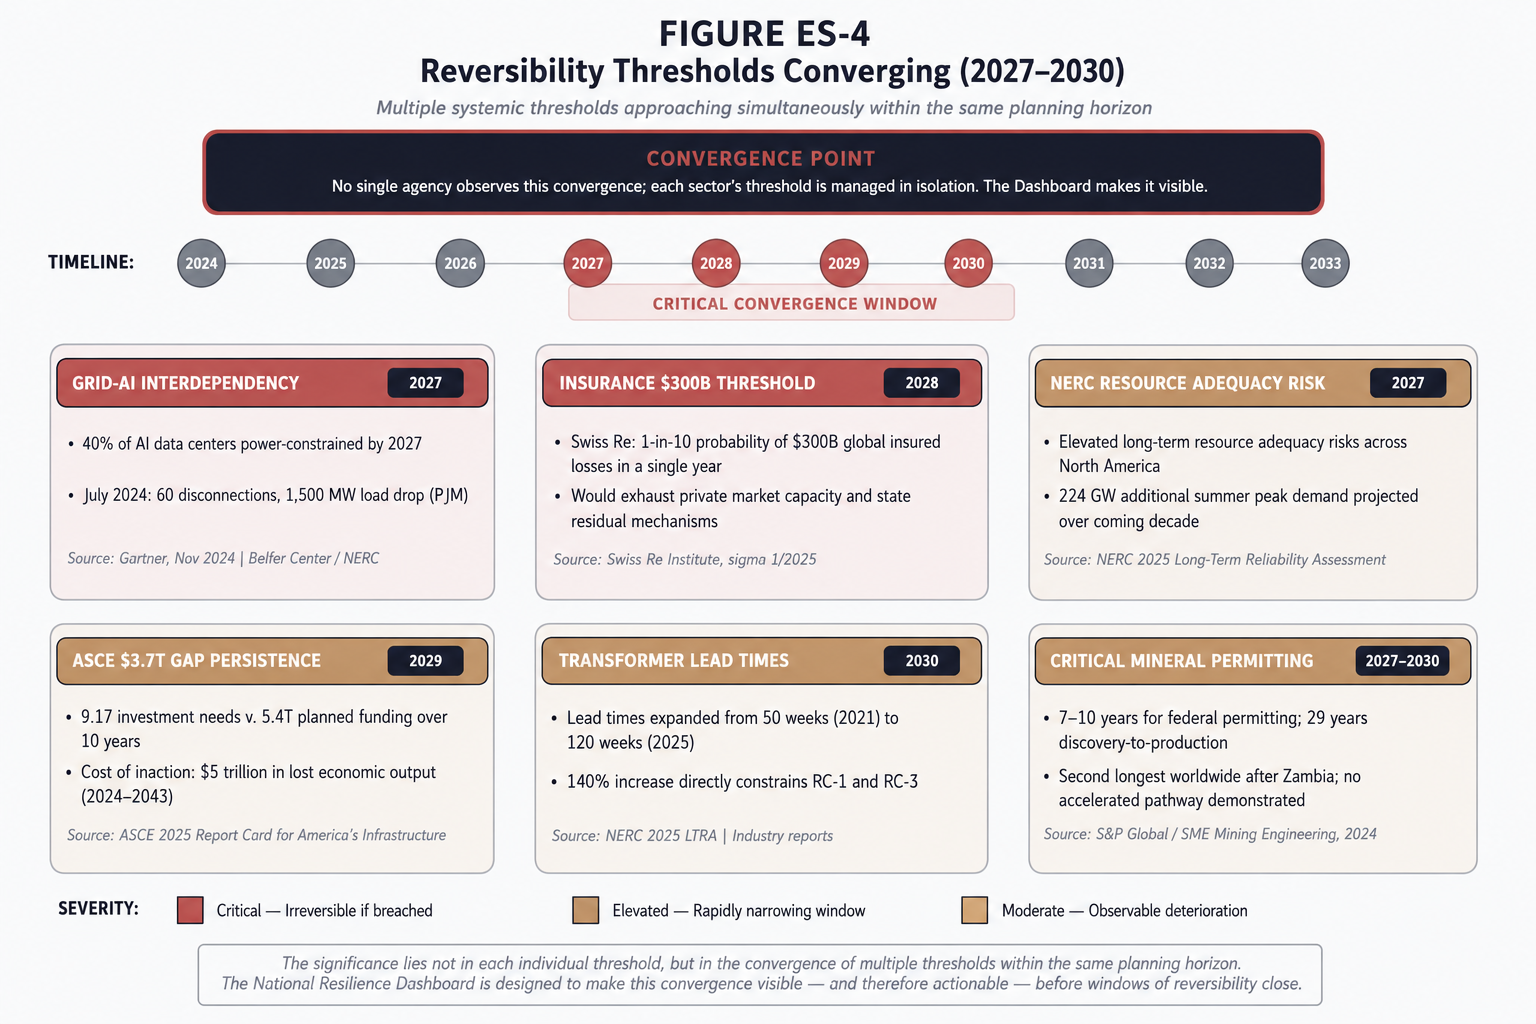
Click image to enlarge.
(2027–2030)
These thresholds do not emerge independently; they converge in the 2027–2030 window:
- Gartner projects 40% of existing AI data centers will be power-constrained by 2027. In July 2024, a minor voltage fluctuation caused 60 data center disconnections and a 1,500 MW load drop in the PJM region — the grid-AI interdependency is already operational, not hypothetical (Gartner, Nov 2024; Belfer Center / NERC).
- NERC identifies elevated long-term resource adequacy and transmission reliability risks across large portions of North America under current planning assumptions (NERC 2025 LTRA). Grid Strategies has questioned NERC's demand-growth assumptions and suggested that the assessment may overstate near-term risk; this divergence is itself an observable uncertainty (σ) signal.
- In insurance, Swiss Re assesses at 1-in-10 the probability of $300 billion in global insured losses in a single year — a level that would exhaust both private market capacity and the fiscal reserves of state residual mechanisms (Swiss Re Sigma 1/2025).
- The ASCE 2025 Report Card estimates $9.1 trillion in investment needs over 10 years against $5.4 trillion in planned funding, leaving a $3.7 trillion gap. The cost of inaction: $5 trillion in lost economic output over 20 years (2024–2043) (ASCE 2025).
The significance lies not in each individual threshold, but in the convergence of multiple thresholds within the same planning horizon. No single agency observes this convergence; each sector's threshold is managed in isolation. The National Resilience Dashboard is designed to make this convergence visible — and therefore actionable — before windows of reversibility close.
(Source: §8, §9, §10.4; Class A/B.)
ES.5 — The National Resilience Dashboard
Click image to enlarge.
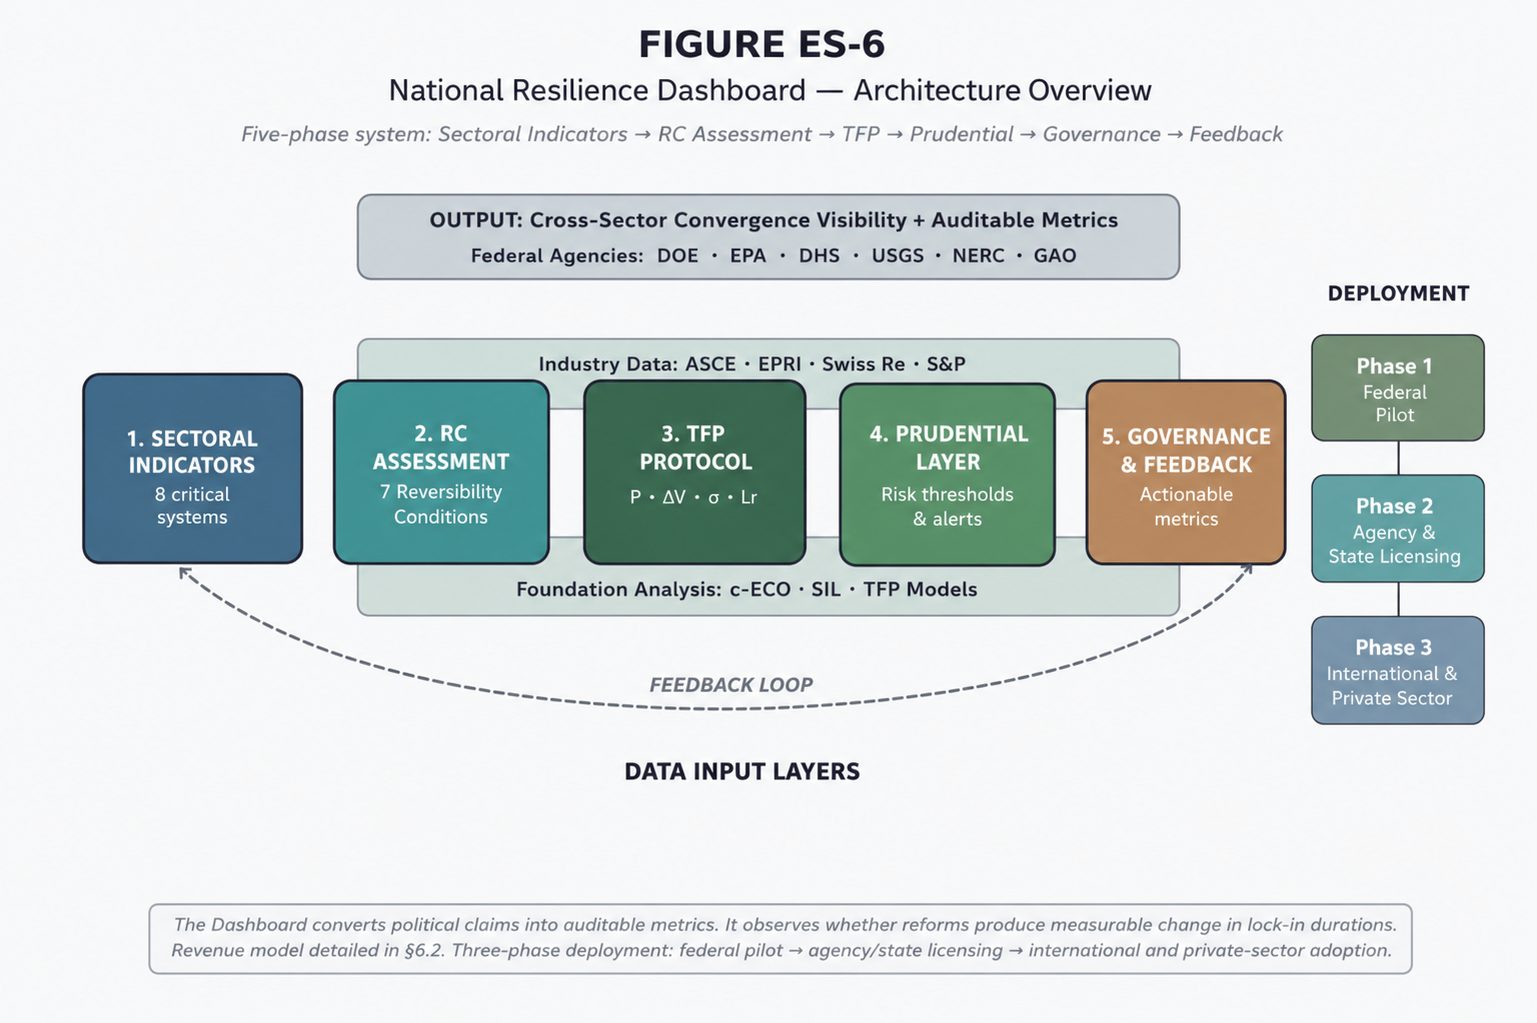
The central recommendation of this memorandum is the establishment of a National Resilience Dashboard integrating RC-1 through RC-7 observability metrics across all eight sectors into a federal cross-sector observability platform. This closes the structural gap identified in the cross-sector assessment — the absence of integrated reversibility observation in combination. No existing framework provides this; each agency sees its own sector, no one sees the system.
Potential institutional homes include CISA and the Office of Financial Research (OFR), both of which possess foundational infrastructure for cross-sector data integration in their respective domains (CISA: critical infrastructure cyber through E-ISAC; OFR: financial market surveillance), which would require expansion to cover all eight sectors.
The Dashboard does not merely diagnose; it measures whether reforms actually move the durations. Current federal posture (EO 14241, FAST-41 expansion, "energy dominance") is actively trying to compress several of these lock-in durations — mining permitting above all. The Dashboard observes whether those reforms produce measurable change, converting a political claim into an auditable metric.
Dashboard Architecture:
- Quarterly Dashboard updates, with annual reporting through the FSOC and Congressional testimony
- Integrates RC observability metrics across all 8 sectors
- Threshold visualization and alert system
- Pre-positioned, not post-hoc — designed to observe whether reforms produce measurable change before windows of reversibility close
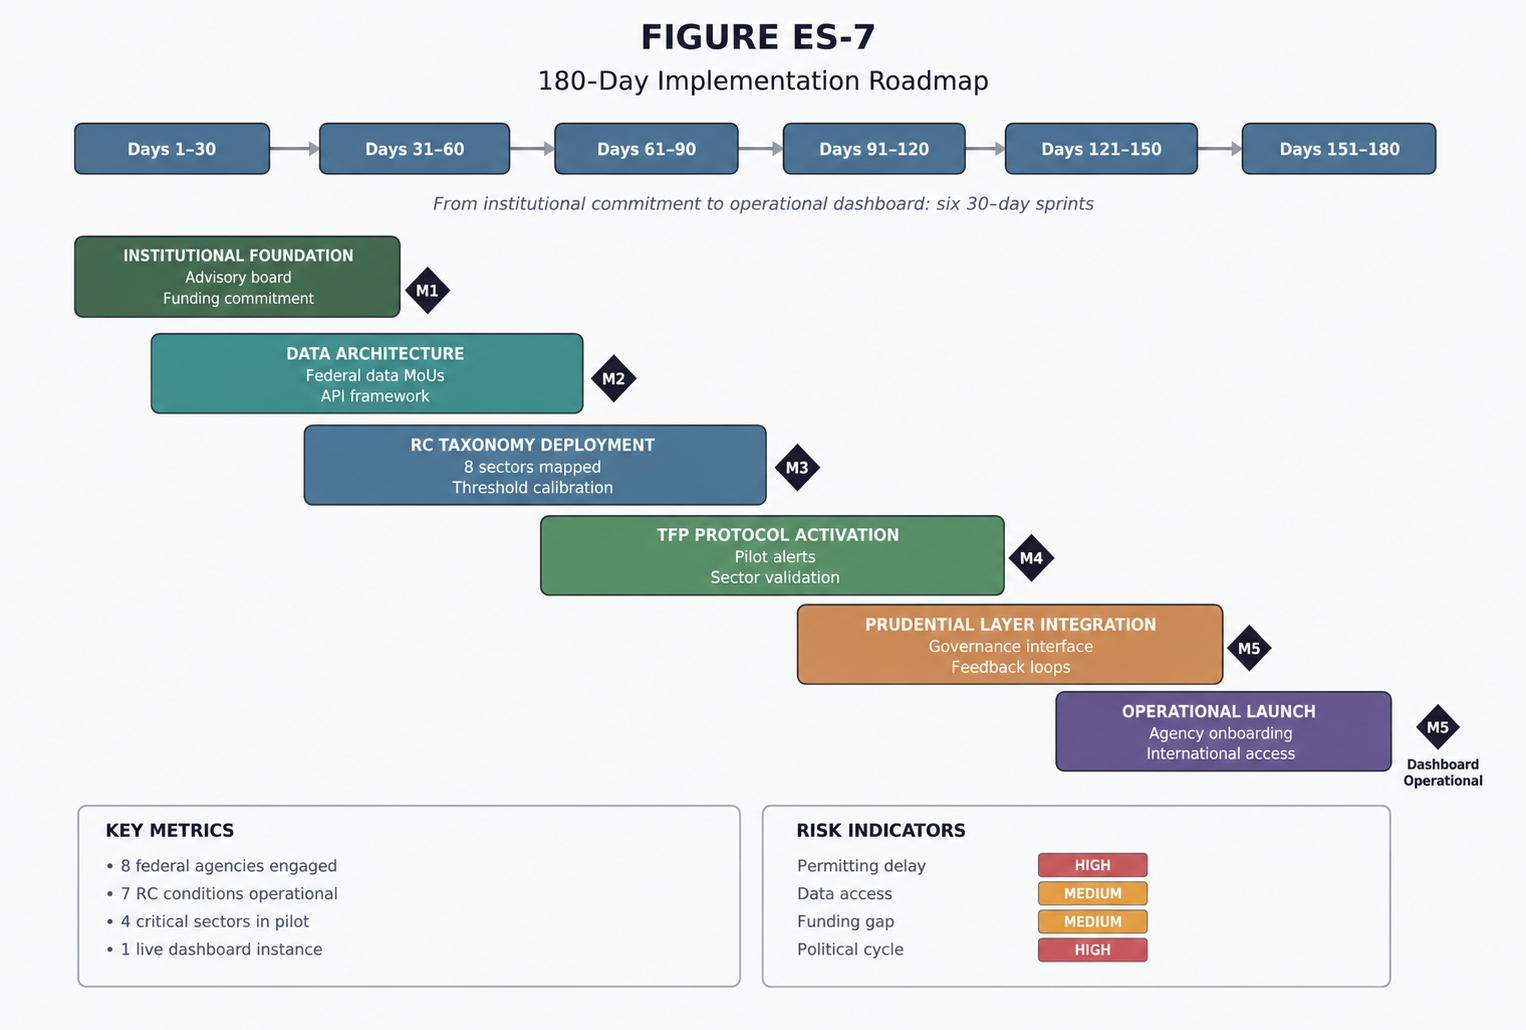
180-Day Implementation Roadmap:
Phase 1 (0–30 Days): Governance Setup — Establish leadership, roles, and oversight; form steering committee and working groups; define governance structure and decision rights; approve implementation charter and priorities; engage key stakeholders. Deliverables: Governance Charter, Stakeholder Map, Work Plan.
Phase 2 (30–60 Days): Data Integration & Standards — Build data foundation and interoperability; define data taxonomy and indicators; integrate priority sector data sources; establish data quality and security protocols; develop data-sharing agreements. Deliverables: Data Dictionary, Integrated Data Layer, Data Governance Protocol.
Phase 3 (60–120 Days): Dashboard Development & Deployment — Deploy prototype and operational dashboard; develop dashboard prototype with core functions; implement lock-in and pressure indicators; configure alerts and thresholds; pilot with select users. Deliverables: Operational Dashboard (v1.0), Alerting System, User Guide.
Phase 4 (120–180 Days): Pilot Operations & Validation — Run pilots, validate, and refine for scale; conduct pilot in priority regions/sectors; validate indicators and response workflows; refine models and thresholds based on feedback; document lessons and best practices. Deliverables: Pilot Evaluation Report, Refined Dashboard (v1.1), Operational Playbook.
Phase 5 (Ongoing): Continuous Monitoring & Improvement — Sustain, expand, and continuously improve; continuous data updates and quality assurance; expand sector and regional coverage; periodic stress testing and scenario updates; annual review and system enhancement. Deliverables: Ongoing Operations, Annual Resilience Report, Continuous Improvement.
Foundational Enablers (Active Throughout): Legal & Policy Alignment; Cybersecurity & Privacy; Capacity Building; Stakeholder Engagement.
Success Metrics: 100% governance structure established; ≥80% priority data sources integrated; ≥90% dashboard uptime during pilot; ≥3 pilot sectors operational; Annual Resilience Review completed.
The Dashboard architecture is designed for three-phase deployment — federal pilot, agency and state licensing, then international and private-sector adoption; the revenue model is detailed in §6.2.
ES.6 — Immediate Implementation Pathway (0–12 Months)
Click image to enlarge.
(0–12 MONTHS)
Four immediate actions that begin closing the gap:
1. NATIONAL RESILIENCE DASHBOARD — Integration of RC metrics across all 8 sectors; quarterly Dashboard updates with annual FSOC reporting. Addresses: RC-7 (Information Visibility) across all sectors. The FSOC 2025 Annual Report confirms the Council's mandate for cross-sector financial stability monitoring and recommends enhanced information sharing among regulators and industry stakeholders (FSOC 2025 Annual Report, U.S. Department of the Treasury).
2. WATER CYBERSECURITY EMERGENCY RESPONSE — Deployment of CISA Rapid Response Teams to the 100 highest-risk water systems within 90 days is recommended. Target: move RC-2 (Response Velocity) from Limited to Partial by demonstrating measurable detection and response capability. The Volt Typhoon persistence demonstrated that current cyber visibility is inadequate; this recommendation creates capability where none exists. Addresses: RC-2 for Water. CISA's 2025 focus on critical infrastructure cyber defense and joint monitoring with industry stakeholders provides operational foundation (FSOC 2025 Annual Report, Section 3.2).
3. GRID INTERCONNECTION EMERGENCY REFORM — A FERC emergency order to process interconnection queues on reliability-need basis, rather than first-come-first-served, is recommended. Target: reduce the ~4.5-year (55-month) queue backlog for reliability-critical projects. The current queue structure treats data center interconnection with the same priority as residential solar; this is structurally inappropriate given the scale and velocity of AI demand growth. Addresses: RC-2 for Energy/Grid. FERC's existing authority under Federal Power Act Section 202(c) provides emergency ordering authority for reliability threats.
4. INSURANCE MARKET STRESS MONITORING — Implementation of monthly FAIR Plan solvency monitoring by the Federal Insurance Office (FIO), with integration into the National Resilience Dashboard, is recommended. Target: systematize RC-7 for insurance by creating real-time visibility into the adverse-selection indicator (uninsured rate). Current monitoring (annual/bi-annual) is insufficient to detect inflection. Addresses: RC-7 for Insurance. The Yale Law Journal (Vol. 135, December 2025) explicitly recommends federal reinsurance for FAIR Plans and residual markets, with FIO monitoring as a prerequisite for program design. Federal reinsurance proposals have been advanced by the Brookings Institution (March 2026) and recommended by the Yale Law Journal (Vol. 135, December 2025), with design principles informed by established precedents such as the National Flood Insurance Program (NFIP), the Terrorism Risk Insurance Act (TRIA), and the Florida Hurricane Catastrophe Fund (FHCF).
(Source: §11, Recs. 1–4.)
ES.7 — Cost of Inaction; Payoff of Action
Click image to enlarge.
COST OF INACTION Estimated cumulative economic losses approaching $5 trillion over two decades under continued systemic deterioration (ASCE, 2025 Report Card for America's Infrastructure).
INVESTMENT GAP Current infrastructure investment shortfall estimated at $3.7 trillion over the coming decade. Transportation ($132 billion) and Water ($155 billion) represent the largest single-category gaps. The total understates the true gap, as it excludes the cost of accelerating mineral production, expanding grid capacity for AI, and backstopping insurance-market contraction (ASCE 2025).
The payoff of action is the preservation of reversibility while it is still measurable and accessible — before observation passes to merely documenting failure in real-time.
Cross-Sector Finding: RC-2 (Response Velocity) and RC-4 (Institutional Flexibility) are LIMITED in all 8 sectors — the most systematic gap. RC-7 (Information Visibility) is strongest. No framework provides integrated observation of reversibility conditions in combination.
Pattern 1 — Visibility-Without-Recovery: Minerals (RC-7 STRONG, RC-1 LIMITED), AI/Data Centers (RC-7 PARTIAL, RC-1 LIMITED), and Insurance (RC-7 STRONG, RC-2 LIMITED) all demonstrate that knowing a problem exists does not create capacity to solve it. This pattern invalidates the implicit assumption of many resilience frameworks that better information leads to better outcomes. Information is necessary but not sufficient; without institutional flexibility (RC-4) and financial absorption (RC-6), visibility may merely document irreversibility in real-time.
Pattern 2 — The RC-2/RC-4 Systematic Gap: Response Velocity (RC-2) and Institutional Flexibility (RC-4) are LIMITED in all 8 sectors. This is not a coincidence — it reflects a structural feature of American federalism. The separation of powers, the division of authority between federal and state governments, and the fragmentation of regulatory jurisdiction across agencies all constrain the speed at which collective action can be mobilized. No sector has demonstrated the capacity to activate corrective measures at the velocity required by the deterioration.
Pattern 3 — Governance-Cycle Mismatch: Infrastructure assets operate on 20–50 year lifecycles. Political cycles operate on 2–4 year intervals. The interconnection queue (~4.5 years), mineral permitting (7–10 years), and lead-line replacement (10 years) all exceed or approach any single administration's effective tenure. Without mechanisms for sustained multi-administration commitment, RC-4 (Institutional Flexibility) cannot improve.
(Source: Card ES; §10, Figure 10-3; §10.3.10.)
ES.8 — Summary of Recommendations
Click image to enlarge.
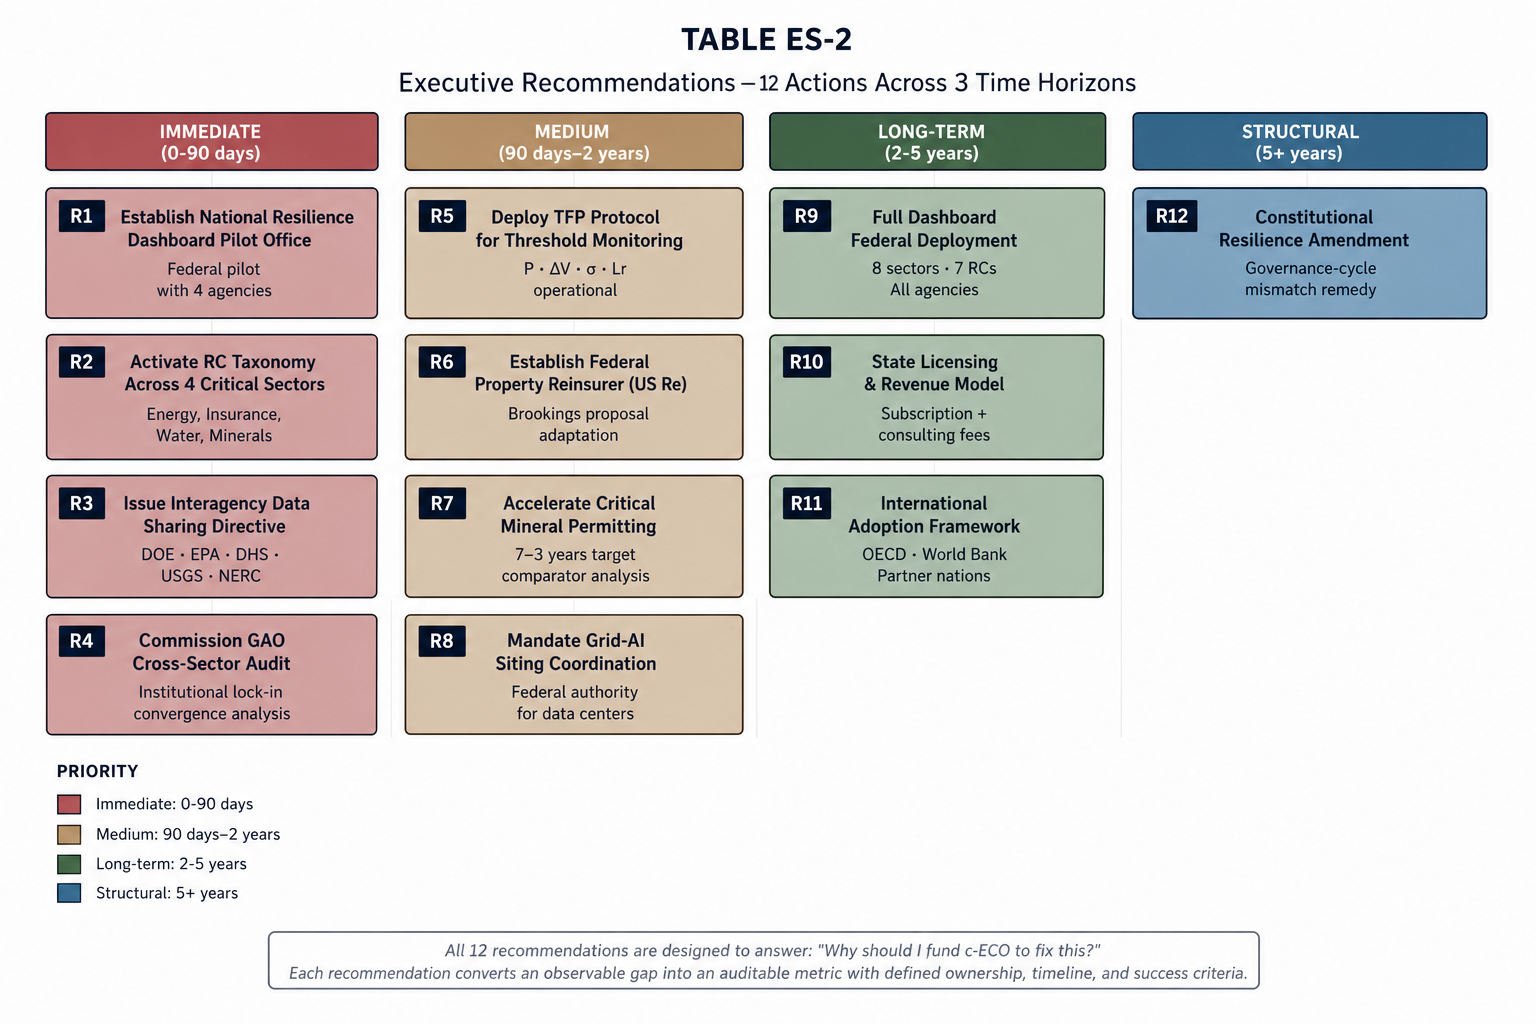
Twelve recommendations, organized by horizon, each linked to the RC condition and sector it addresses:
IMMEDIATE (0–12 MONTHS): 1. National Resilience Dashboard — RC-7 across all sectors. Potential institutional homes include CISA and OFR; quarterly Dashboard updates with annual FSOC reporting and Congressional testimony.
2. Water Cybersecurity Emergency Response — RC-2 for Water. Deployment of CISA Rapid Response Teams to the 100 highest-risk water systems within 90 days.
3. Grid Interconnection Emergency Reform — RC-2 for Energy/Grid. FERC emergency order for reliability-need queue processing.
4. Insurance Market Stress Monitoring — RC-7 for Insurance. FIO monthly FAIR Plan solvency monitoring integrated into Dashboard.
MEDIUM-TERM (1–3 YEARS): 5. Transformer Strategic Reserve — RC-1, RC-3 for Energy/Grid. Establishment of a federally managed strategic reserve of large power transformers is recommended. Current lead times of 120 weeks mean that a major transformer failure creates a multi-year vulnerability window; a strategic reserve reduces recovery time from years to weeks.
6. Federal Reinsurance Program — RC-6 for Insurance. Lower-cost federal reinsurance for state FAIR Plans, triggered by statewide loss ratios exceeding defined thresholds. Modeled on the terrorism risk guarantee structure (TRIA), but applied to climate-correlated natural catastrophe. Pre-positioned, not post-hoc. The Brookings Institution (March 2026) and Yale Law Journal (Vol. 135, December 2025) both advance federal reinsurance proposals, with design principles informed by established precedents such as NFIP, TRIA, and FHCF.
7. Submarine Cable Protection Initiative — RC-5 for Telecom. A coordinated strategy with allies to protect cable infrastructure is recommended, including mandatory cable diversity requirements for systems designated as critical. The FCC adopted rules in August 2025 to accelerate submarine cable buildout and security, including "presumption of denial" for foreign adversary-controlled license applicants and prohibition of high-risk equipment (FCC Report and Order, August 7, 2025). International coordination on submarine cable security is emerging, with allied nations developing complementary frameworks.
8. AI Data Center Siting Framework — RC-4 for AI/Data Centers. Federal guidelines requiring load flexibility commitments and water-free cooling for large-scale AI data center deployments are recommended. Creates institutional coordination between data center development and grid planning where none currently exists.
LONG-TERM STRUCTURAL (3–10 YEARS): 9. Infrastructure Investment Sustainability — RC-3 across all sectors. Reauthorization of IIJA programs is recommended; all sectors dependent on IIJA funding face a fiscal cliff. Without sustained funding, the observability improvements achieved through BIL-funded programs (lead line replacement, broadband deployment, port modernization) will reverse.
10. Critical Minerals Permitting Reform — RC-4 for Minerals. Acceleration of permitting toward internationally competitive timelines is recommended, through statutory NEPA reform and delegation to state geological surveys where capacity exists. Directly addresses RC-4 by closing the recognition-to-action gap.
11. National Supply Chain Resilience Standard — RC-7 for Supply Chains. Mandatory risk disclosure for public companies in critical sectors — concentration metrics, foreign dependency ratios, alternative supplier identification. Creates visibility where none currently exists.
12. Cross-Sector Exercise Program — RC-2 across all sectors. Annual national exercises testing compound disaster scenarios (e.g., Category 5 hurricane + grid failure + insurance market stress) are recommended. Builds institutional muscle memory for multi-sector coordination.
(Source: §11, Recs. 1–12.)
Table — Sector Status Summary
Aggregate Systemic Pressure Score (ASPS) = 0.735 (ELEVATED). The threshold of 0.70 separates Elevated from Critical. All sectors except Telecom are at or above 0.70.
| Sector | Status | Primary Driver | Institutional Lock-in Duration |
|---|---|---|---|
| Energy/Grid (SPS 0.85) | Critical | +224 GW demand; transformers 120 weeks; queue ~55 months | ~4.5 years |
| Insurance | Critical | $112.7B losses; uninsured ~13%; adverse-selection spiral | ~30 years |
| Critical Minerals | Critical | China 98% gallium; zero production of numerous minerals | 7–10 years |
| Water | Critical | 9.2M lead pipes; cyber gaps; Volt Typhoon | 10 years |
| AI/Data Centers | Critical | 40% power-constrained by 2027; queue delays | Multi-year (large-load) |
| Supply Chains | Critical | China ~40% pharma inputs; no reshoring strategy | — |
| Ports | Critical | Grade C; ~$38B needs; PIDP oversubscribed | — |
| Telecom (SPS 0.55) | Elevated | 44 publicly reported global cable damages (2024–25); ACP ended (~23M households) | — |
Cross-Sector Finding: RC-2 (Response Velocity) and RC-4 (Institutional Flexibility) are LIMITED in all 8 sectors — the most systematic gap. RC-7 (Information Visibility) is the strongest. No framework provides integrated observation of reversibility conditions in combination.
The matrix reveals that no sector has more than 2 STRONG ratings, and no sector has any STRONG rating in RC-2 or RC-4. RC-7 (Visibility) is the only condition that achieves STRONG in any sector — and even there, the visibility is of symptoms (losses, lead times, queue lengths) rather than of recovery pathways. The systematic limitation of RC-2 and RC-4 across all sectors is the most consequential finding of this assessment: the United States can see its infrastructure deteriorating, but cannot mobilize corrective action at the required velocity.
Reading Paths by Role
| Policymakers / Legislators | ES → Chapters 1, 6, 9, 10 → Appendix G (Legislation Templates) |
| Technical Analysts | ES → Chapters 2, 4, 5, 7 → Volume II (Technical Companions) |
| Sector Specialists | ES → Relevant Chapter (3 or 8) → Volume II (TC-01 through TC-08) |
| Investors / Risk Managers | ES → Chapters 9, 10.4 (TFP Insurance Demo) → Appendix A (Jurisprudential Validation) |
| Researchers | ES → Chapter 8 (Open Research Agenda) → Volume II Technical Companions |
| Implementation Officers | ES → Chapter 6 (Federal Adoption) → Volume III (Implementation Toolkit) |